Thermostat
Simulation of a thermostat with threshold-based switching between heater states.
You can also find this example as a single file in the GitHub repository.
The continuous dynamics part of the system has the following two ODEs for the two heater states:
MATHDISPLAY0ENDMATH
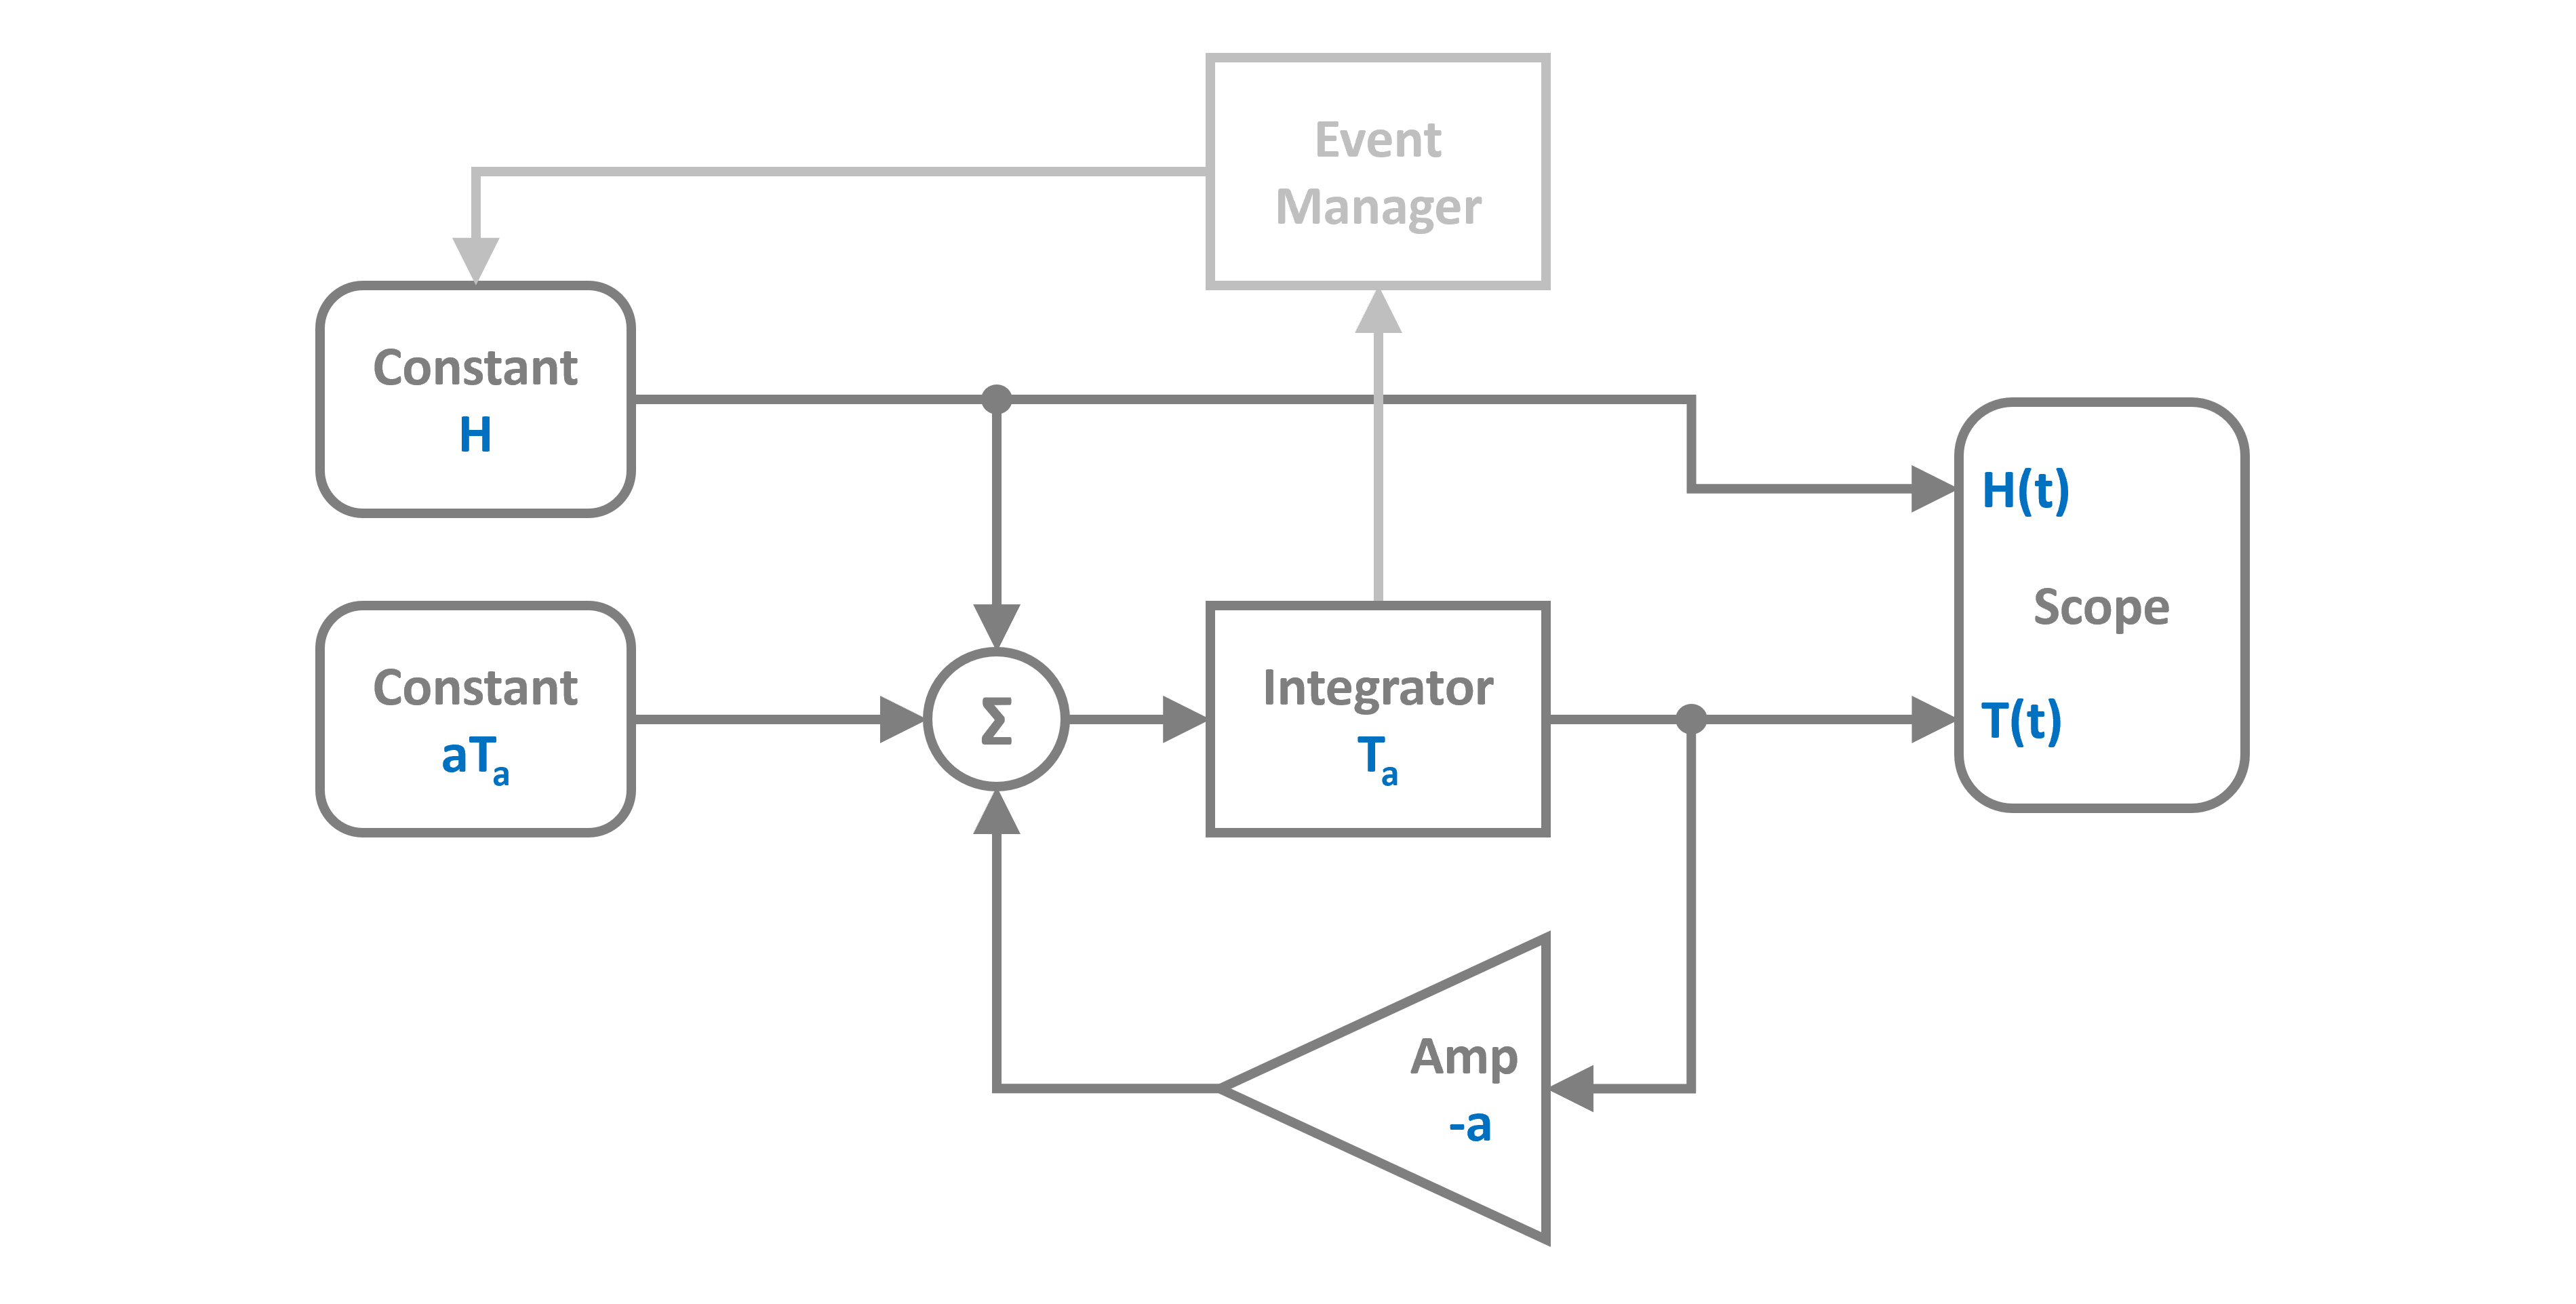
With some algebraic manipulations we can translate the system equation into a block diagram that can be implemented in PathSim. Note the event manager, that watches the state of the integrator and controls the heater.
Lets start by importing the Simulation and Connection classes and the required blocks from the block library. In addition to this we also need to define events to detect the threshold crossings for the regulator.
Then lets define the system parameters.
Now we can construct the continuous dynamic part of the system (its just a linear feedback system) by instantiating the blocks we need with their corresponding prameters and collect them together in a list:
Afterwards, the connections between the blocks can be defined. The first argument of the Connection class is the source block and its port. The following blocks are the target blocks and their target ports:
Next we need to implement the event managers for the threshold based switching between the two heater states.
Finally we can instantiate the Simulation with the blocks, connections, events and some additional parameters such as the timestep.
To enable backtracking for the event manager, we need to use an adaptive timestep integrator. Here we go for RKBS32 which is a 3rd order Runge-Kutta method and essentially the same as Matlabs ode23.
12:44:08 - INFO - LOGGING (log: True)
12:44:08 - INFO - BLOCKS (total: 6, dynamic: 1, static: 5, eventful: 0)
12:44:08 - INFO - GRAPH (nodes: 6, edges: 7, alg. depth: 3, loop depth: 0, runtime: 0.104ms)
Then we can run the simulation for some duration and see what happens.
12:44:08 - INFO - STARTING -> TRANSIENT (Duration: 30.00s)
12:44:08 - INFO - --------------------   1% | 0.0s<0.2s | 2442.0 it/s
12:44:08 - INFO - ####----------------  20% | 0.0s<0.1s | 3764.7 it/s
12:44:08 - INFO - ########------------  40% | 0.1s<0.1s | 3722.4 it/s
12:44:08 - INFO - ############--------  60% | 0.1s<0.1s | 3499.2 it/s
12:44:08 - INFO - ################----  80% | 0.2s<0.0s | 3426.5 it/s
12:44:08 - INFO - #################### 100% | 0.2s<--:-- | 3126.8 it/s
12:44:08 - INFO - FINISHED -> TRANSIENT (total steps: 631, successful: 607, runtime: 199.94 ms)
Due to the object oriented and decentralized nature of PathSim, the Scope block holds the recorded time series data from the simulation internally. It can be plotted directly in an external matplotlib window using the plot method

There we can clearly see the switching of the heater and the room temperature oscillating between the upper and lower threshold. We can also add the events to the plot by just iterating the events to get the detected event times
